Investability of Africa’s listed markets
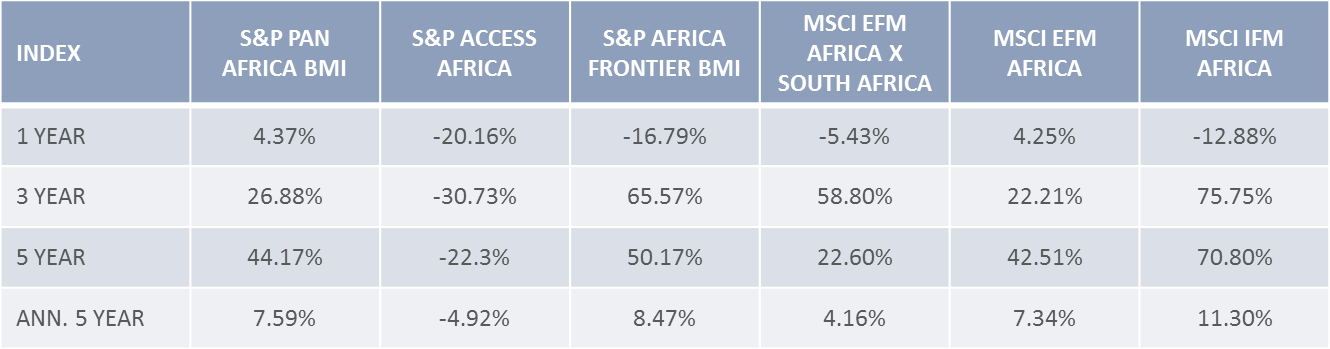
Indices provided by data vendors are used by institutional investors as proxies for African markets by return (performance benchmarking), valuation, liquidity and diversification to assess Africa’s Listed Markets Investability. There are numerous choices as most are designed for a specific type of investor, as well as what their perceived idea of “Africa” is. It is interesting to note that the worst performing index is S&P Access Africa, the only index with exposure to shares listed outside the continent with 36% in South Africa, 28% in UK and 22% in Canada. The main reason for this was the 56% sector bias of these ex-Africa listed shares to the energy and resources sectors.
The best performer was MSCI FM Africa with no exposure to South Africa, no exposure to shares listed outside the continent and 50% exposure in Nigeria. This index had a 50% exposure to financials.
Variety of Return Characteristics of Africa Indices
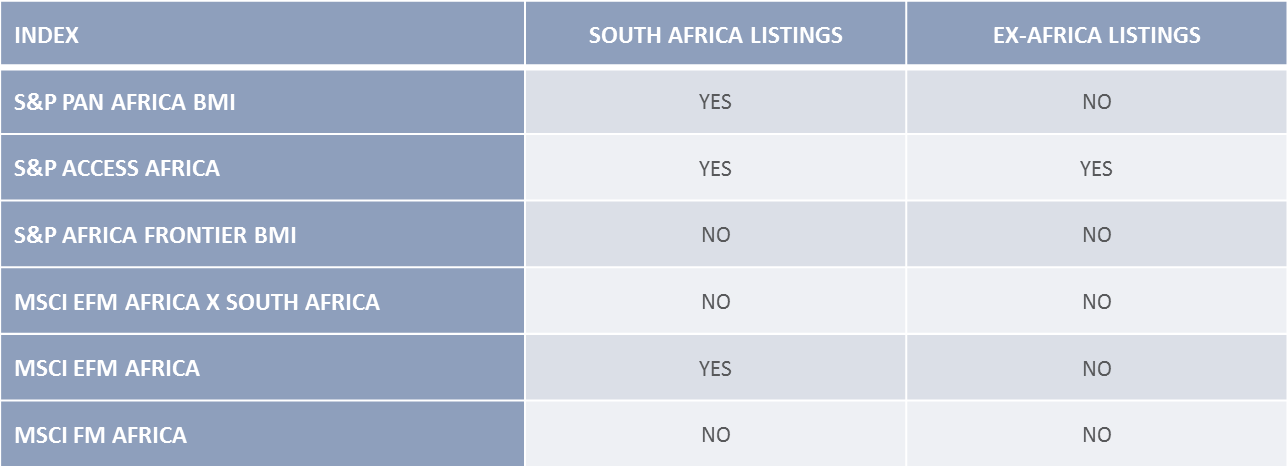
These indices attempt to represent the investible portion of the markets they cover, by investing via the following geographical locations:
Listing Allowance of Africa Indices
Company ownership traits in Africa imply relatively lower free float in comparison to the larger emerging and developed markets as shares are usually held with a longer term view as a function of lower capital mobility – parent companies owning a large percentage of issue as well as a large proportion of family owned businesses coming to market. Of the Africa indices on offer, the average investable ratio is 54%, compared to the UK listed market, which is 85% investable. By decreasing the gap between Total Market Cap and Float Market Cap there will be more liquidity in the market that will lead to improved price discovery.
By merging all African Indices together and separating them by sector, it becomes clear that exposure to energy and materials (mining) companies can be gained predominantly through African companies listed in the UK, Canada and the US. IT, healthcare, industrials, consumer discretionary and telecoms are predominantly listed in South Africa, while utilities, consumer staples and financials are accessible through a broader range of African markets.
Looking to ex-Africa listings, investors are able to gain access to countries without stock exchanges. Unsurprisingly these are countries dominated by GDP exposure to the materials and energy sectors. Including ex-Africa listings also improves liquidity.
Previous versions of this report have spoken to the disconnect between what is accessible in Africa via the listed markets in relation to the GDP outputs of the countries in Africa, which are linked to expected growth prospects. By including all available access mechanisms for listed investing (Africa, South Africa and Ex-Africa) the numbers begin to change. Nonetheless this is still an issue in many sectors across countries.