South Africa no longer dominates private equity transaction in Africa
Private equity investors are shifting their focus away from South Africa and finding opportunities to capture growth in the rest of the continent.
According to the 2018 Bright Africa Report, produced annually by RisCura, South Africa has always made up a large proportion of private equity (PE) transaction activity. However, this concentration has reduced significantly from 50% in 2009 to 31% in 2017, the latest numbers show.
“Sluggish GDP growth, political uncertainty and increasing unemployment, all of which have been prevalent in the local economy for some time have caused investors to look for PE prospects elsewhere,” says Heleen Goussard, head of Unlisted Investment Services at RisCura and the principal author of Bright Africa 2018.
The report, which has just been released, shows that total PE activity in Africa increased by 7% from 2016 to 2017 as fund managers continued to deploy the significant amount of dry powder created in the market during the 2013 and 2015 fundraising years.
Perceived risk has declined
Risk versus reward is a key determinant of investment activity. Cost of equity is representative of the investor’s evaluation of the risk that the enterprise is exposed to. RisCura estimates that the GDP weighted cost of equity* for the continent is 21% and has decreased in the current year by 0.35%.
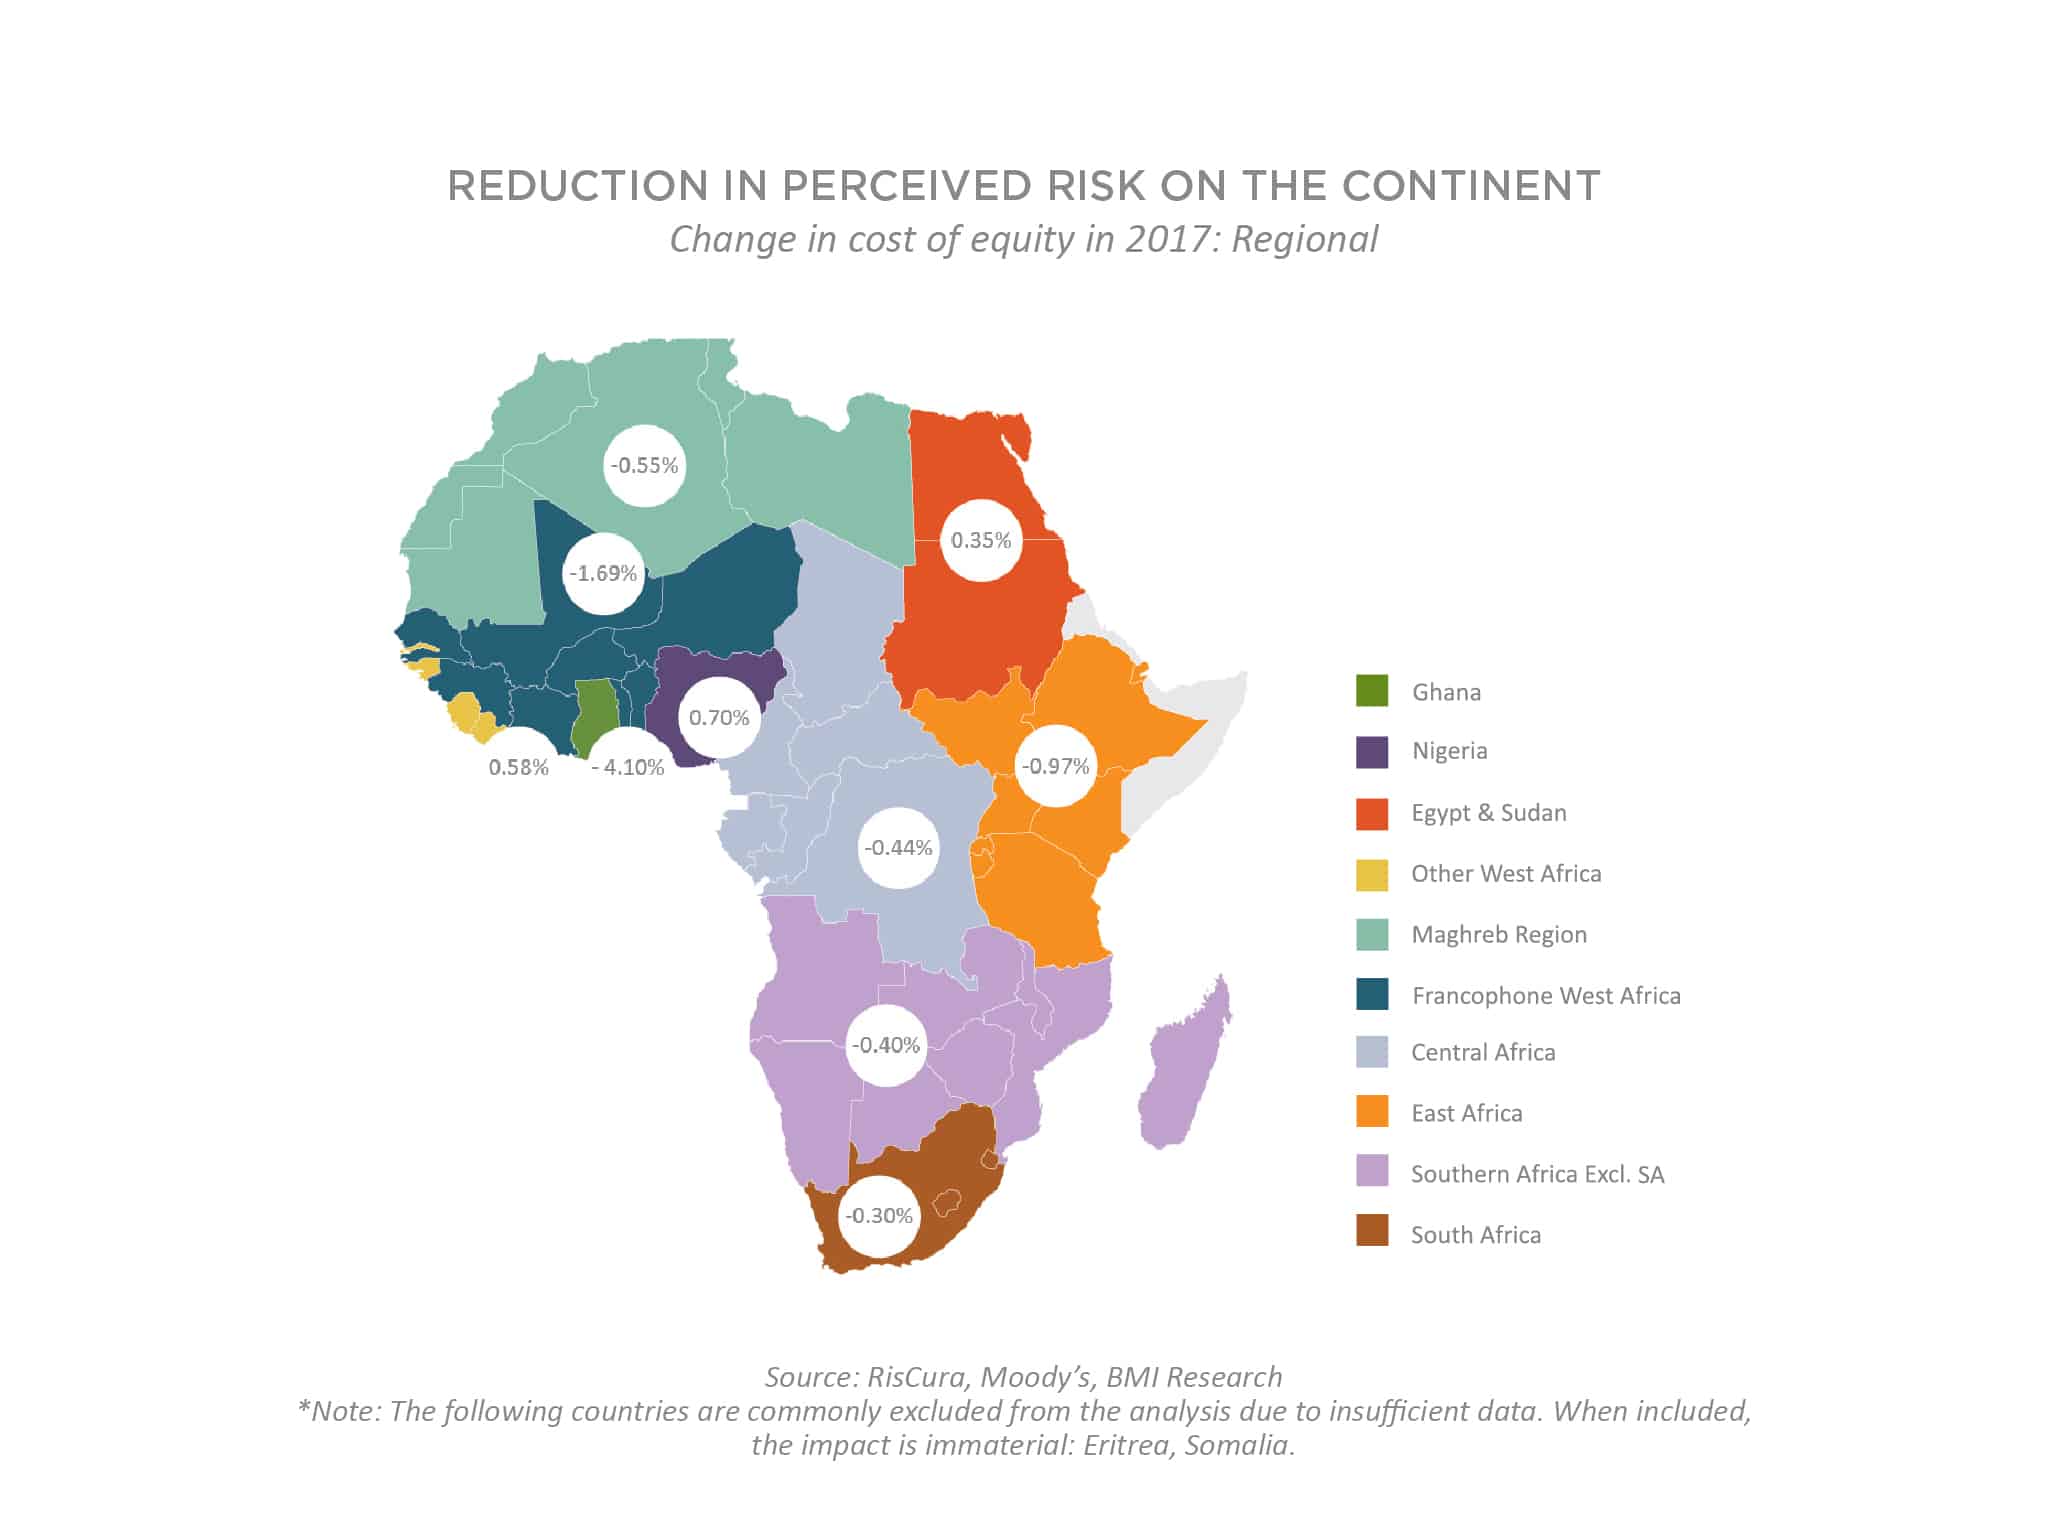
In 2017, most markets showed a decrease with Egypt & Sudan; Nigeria and Other West Africa being the only markets to record increases. Sudan’s current political instability and hyper-inflation drives the increase in that market, while Nigeria’s relatively small increase represents the final negative impact of the commodity cycle and the resulting currency devaluation.
Having carried out their Bright Africa research initiative since 2013, RisCura has found that it makes more sense to analyse the continent by what it terms “meaningful markets.”
“Africa is not a single investment destination with a single set of standardised risk factors and homogenous potential for reward. Segmenting Africa into meaningful markets is an important exercise,” says Goussard.
Although some high-level similarities are evident, digging down into the specifics of certain regions and countries shows that Africa is comprised of a range of distinct investment destinations; each with its own attractions, flaws, cultural differences and business practices.
“By analysing cultural connections, interconnectivity through trade blocs, sharing of expertise, good business relations, and relative ease of transportation, and the support a country receives from its regional partners allows investors to identify the long-term potential of an investment by better understanding the potential growth areas into neighbouring countries.”
Where are the opportunities?
“We’ve seen increases in deal activity in Nigeria and East Africa over the past year,” Goussard says.
This has been driven by improved investor sentiment resulting from higher than expected GDP growth, recovery of the oil price, government incentives and improved foreign exchange liquidity. Deal activity in East Africa in 2017 has mostly been driven by Kenya and Uganda, with the former contributing 61% to East Africa’s total deal activity.
Kenya continues to dominate the East African PE investment landscape because of the country’s large and diversified economy, pro-business government policies and relatively low dependence on extractive commodities. The country has continued to grow at 5% annually in real terms over the past five years.
Deal activity in Egypt has increased to 9% of total transactions in 2017 (2016: 6%). The increase has been driven by the rise in investor confidence following the devaluation of the Egyptian Pound in September 2016 and a series of regulatory reforms instituted in June 2017 that provide various investment incentives.
Egypt was ranked as the No. 1 investment destination in Africa by RMB’s “Where to invest in Africa” 2018 report and has seen a significant increase in foreign direct investment (FDI) inflows in recent years
Heleen Goussard,
head of Unlisted Investment Services, RisCura
* Note to editors: GDP weighted cost of equity is calculated using the Real GDP estimate from BMI Research for each country. Each country’s contribution is equal to that country’s GDP over the entire GDP of the continent, multiplied by the country’s cost of equity.
* This article first appeared on FA News on 27 September 2018.